
Search, chart, monitor & investigate your logs.
Point your logs at HeliosLogs and get a pipelined query language, dashboards, alerting, and an AI agent that does the digging — all from one process.
Install on Linux or macOS
Everything you need to get answers from logs
Ingest anything
Native NDJSON over HTTP, Syslog, and drop-in compatibility APIs. Schema-on-read — ship a field and it's instantly queryable.
A query language for logs
Full-text, fields, wildcards and ranges — then pipe into stats, timechart, top and where for real analytics.
Dashboards & monitoring
Build dashboards from widgets, define threshold and AI monitors, and route alerts to webhooks or Slack.
An AI agent that investigates
An in-app agent searches, aggregates and charts your logs to explain incidents — and runs on a schedule as an AI monitor.
Built-in MCP server
Expose the same toolset to Claude Desktop, Claude Code, Cursor, or any MCP client over one HTTP endpoint.
Enterprise-ready
RBAC, SAML SSO, scoped API keys, an encrypted control plane, an optional S3/NFS shared store with DR, and a FIPS 140-3 build.
From firehose to answer
Ingest with a single request, query with a language built for logs, and let the agent do the digging.
Send your logs
Push NDJSON over HTTP — or point an existing shipper at the drop-in endpoints.
curl 'https://logs.example.com/api/ingest?index=app' \
  -H 'content-type: application/x-ndjson' \
  --data-binary @app.ndjson
Search & analyze
Full-text and fields up front, pipeline operators for the analytics.
service:checkout level:error
| timechart span=5m count by status
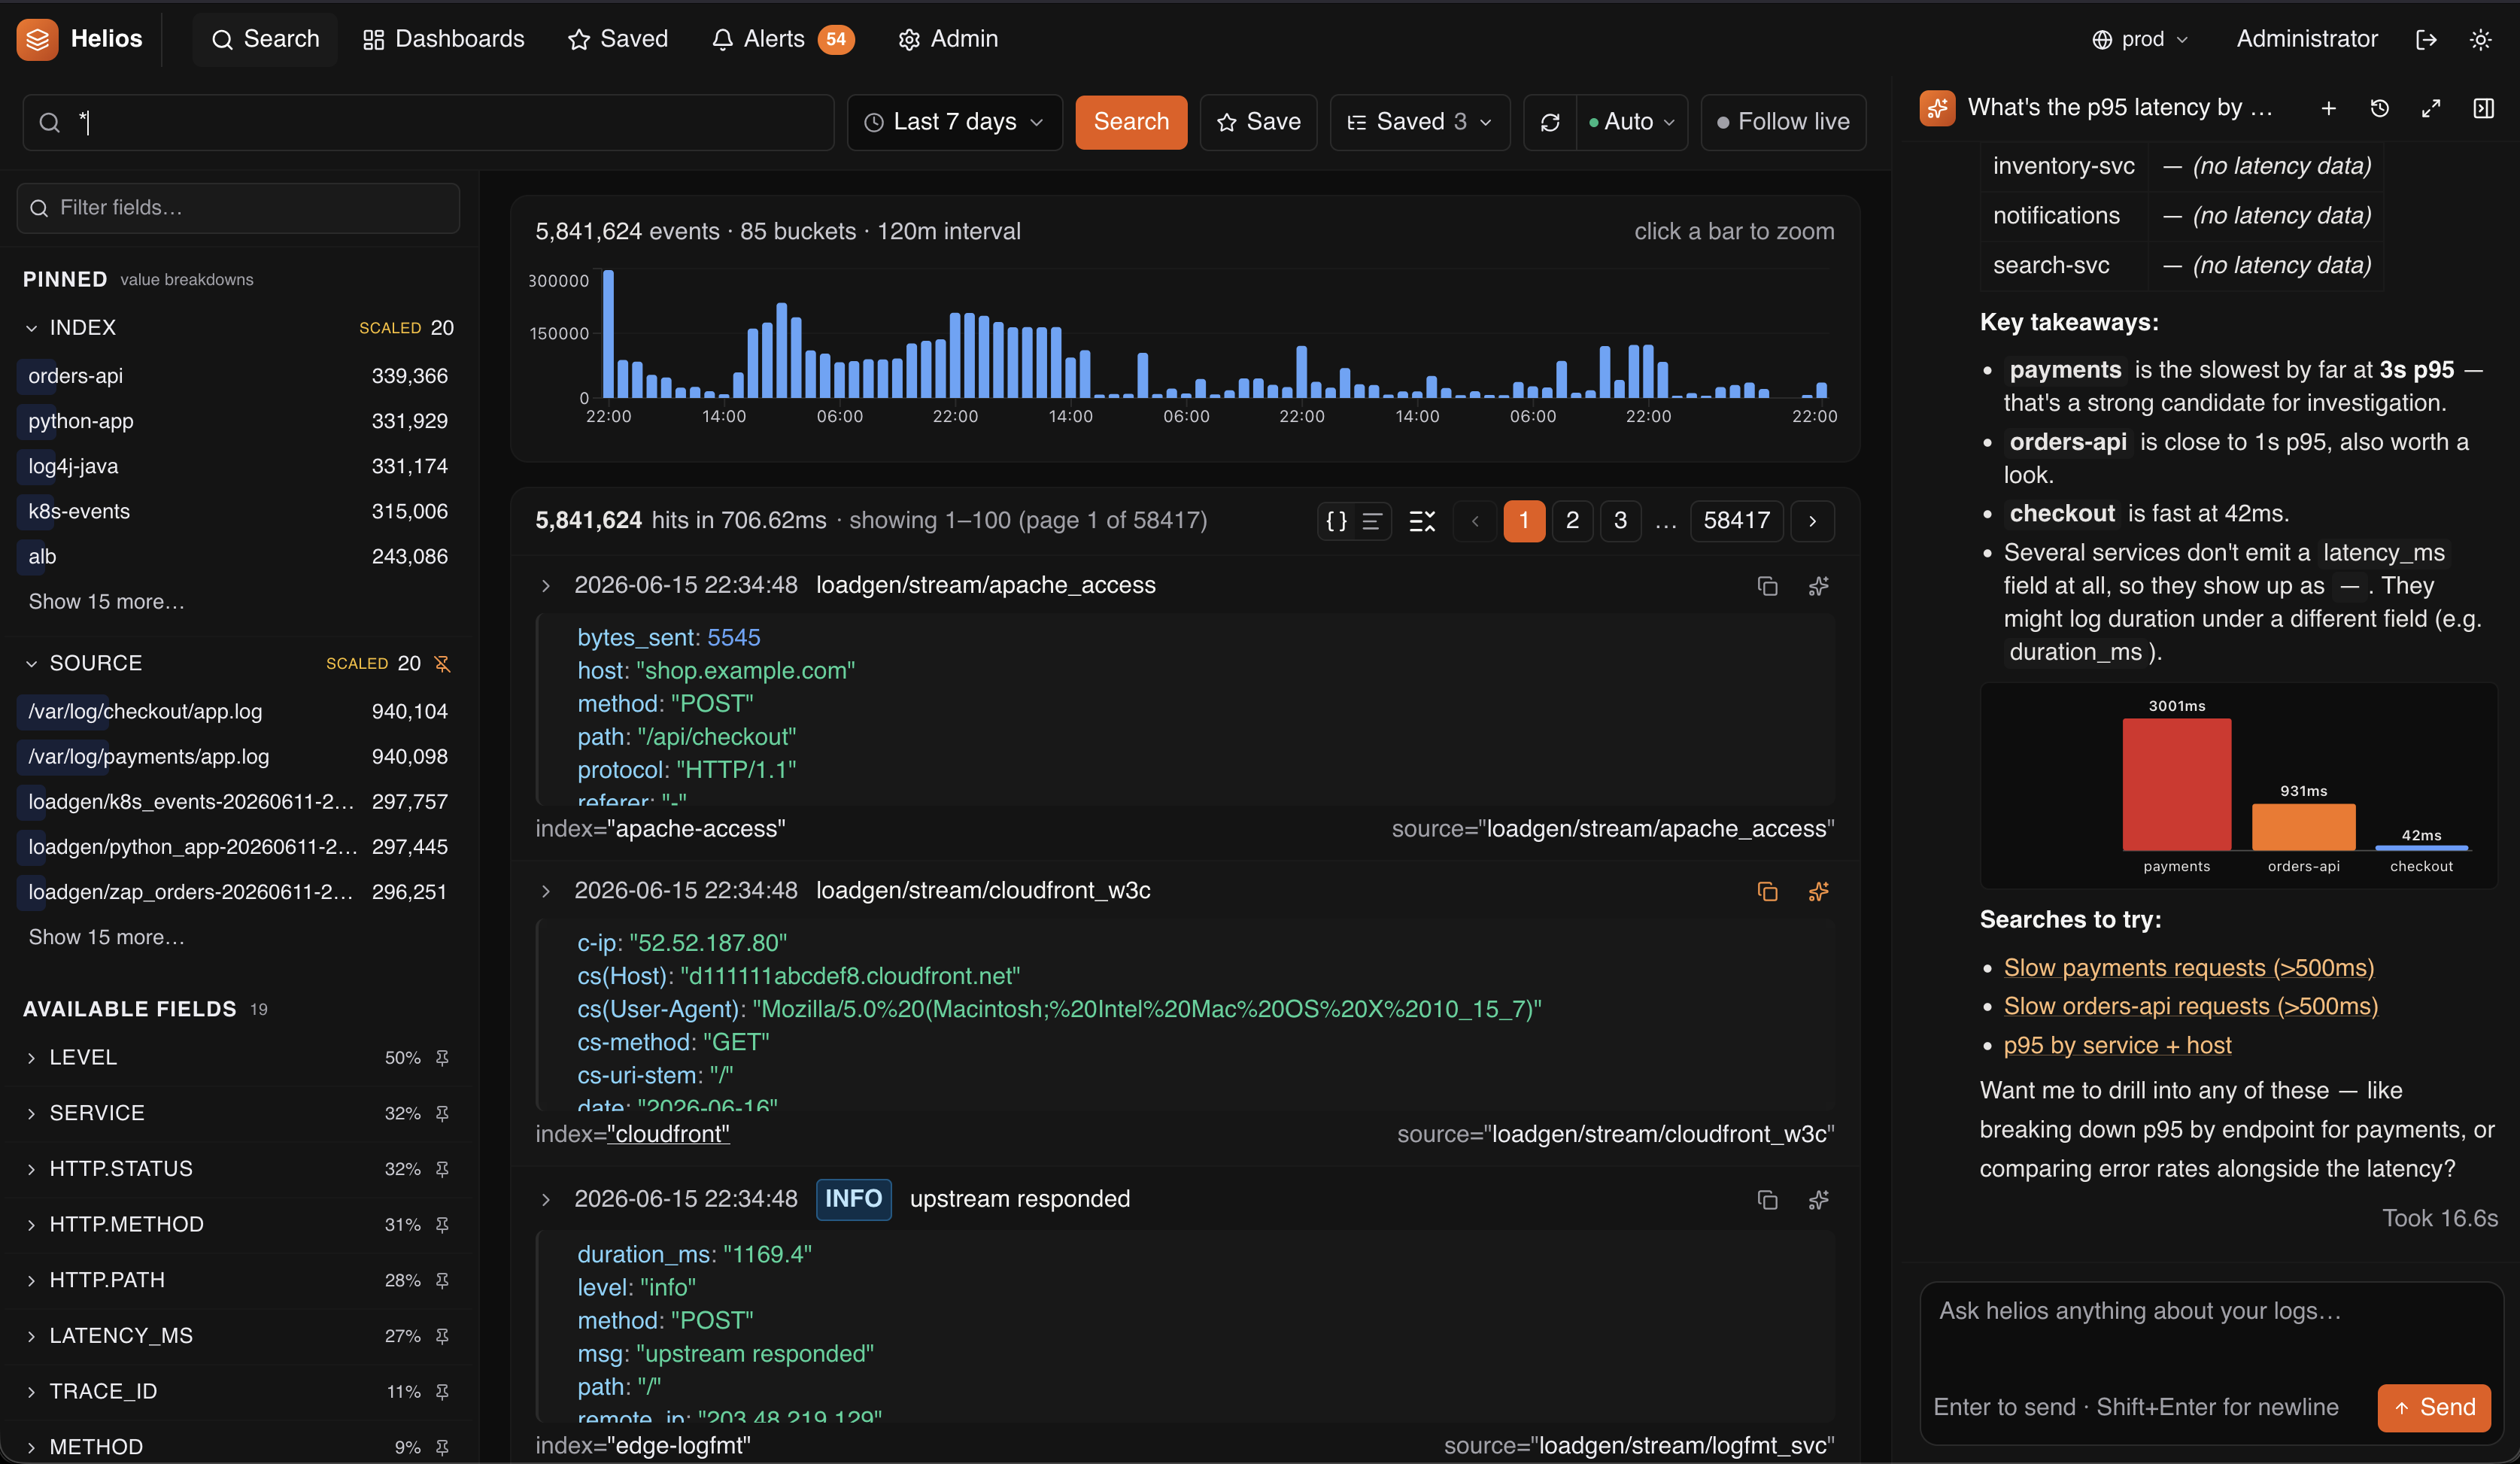
Ask the agent
Skip the query. Describe the problem and read the answer.
Why did checkout 5xx spike at 14:00, and which dependency is to blame?
Agent searches, charts and explains — payments p95 at 3s is the culprit.
Monitors that think, dashboards that stay live
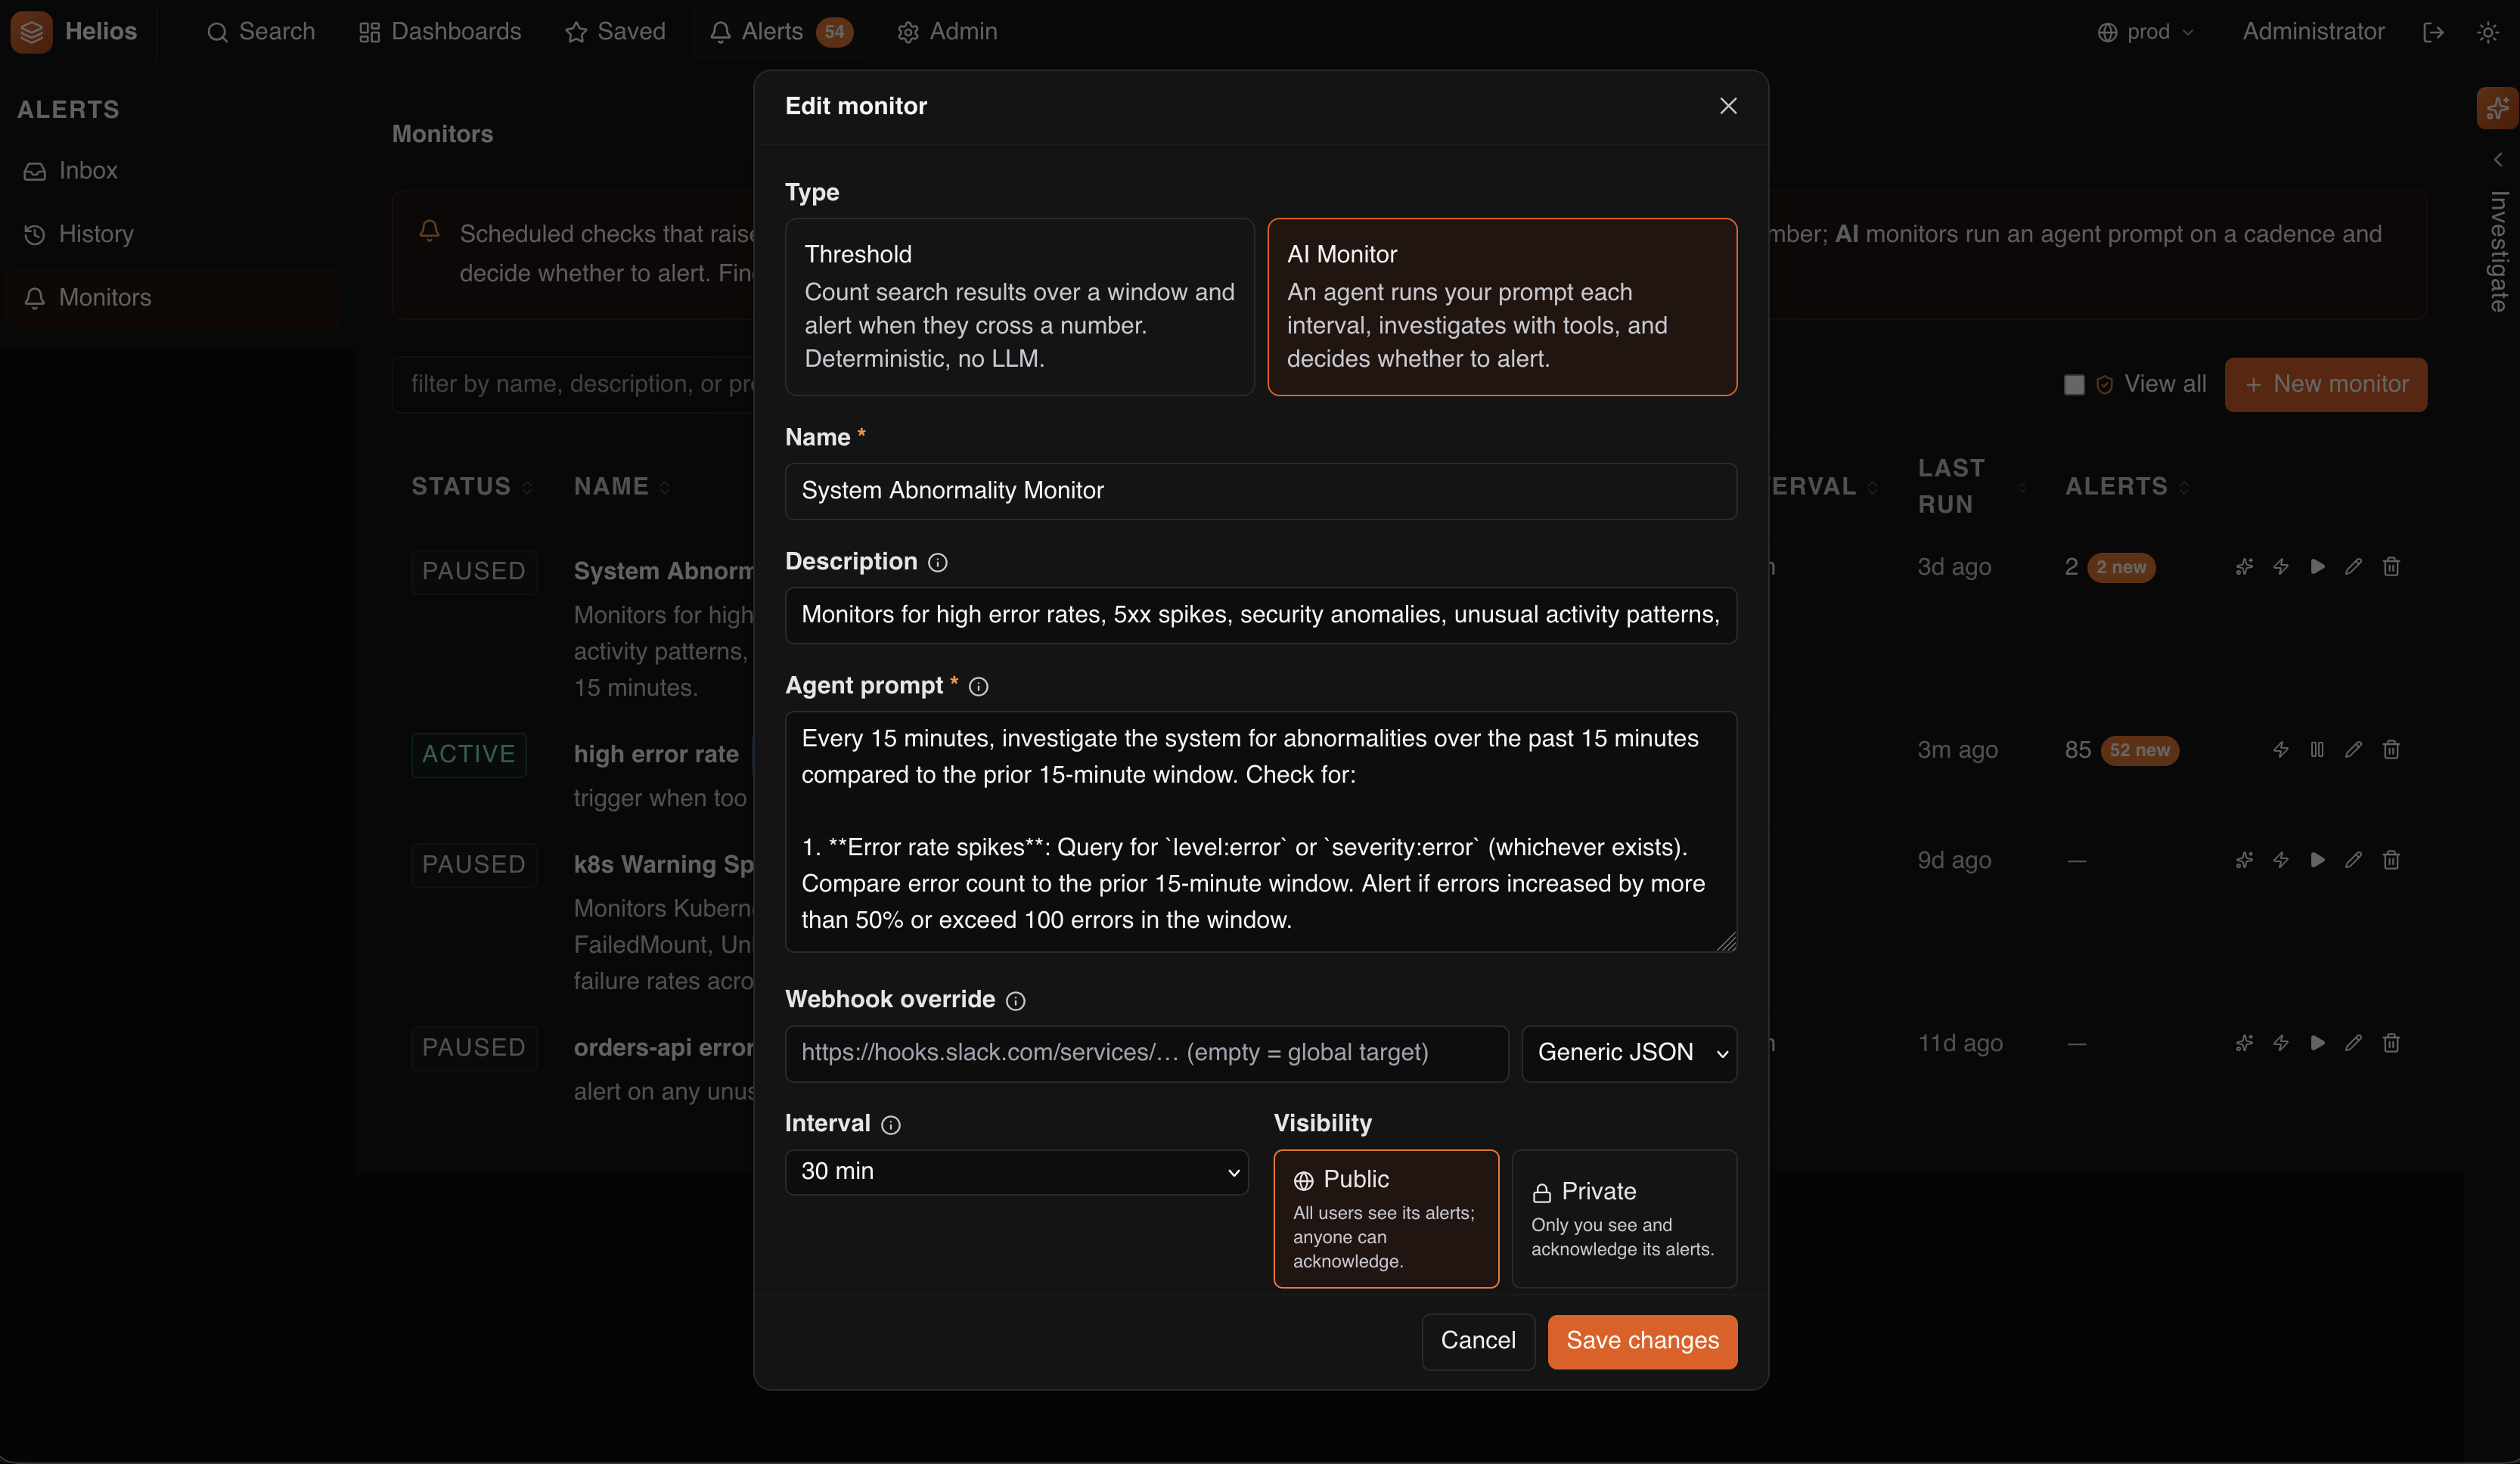
AI monitors in plain English
Describe what to watch for; the agent runs on a schedule and alerts you — catching the fuzzy conditions a threshold can't express, with its reasoning attached.
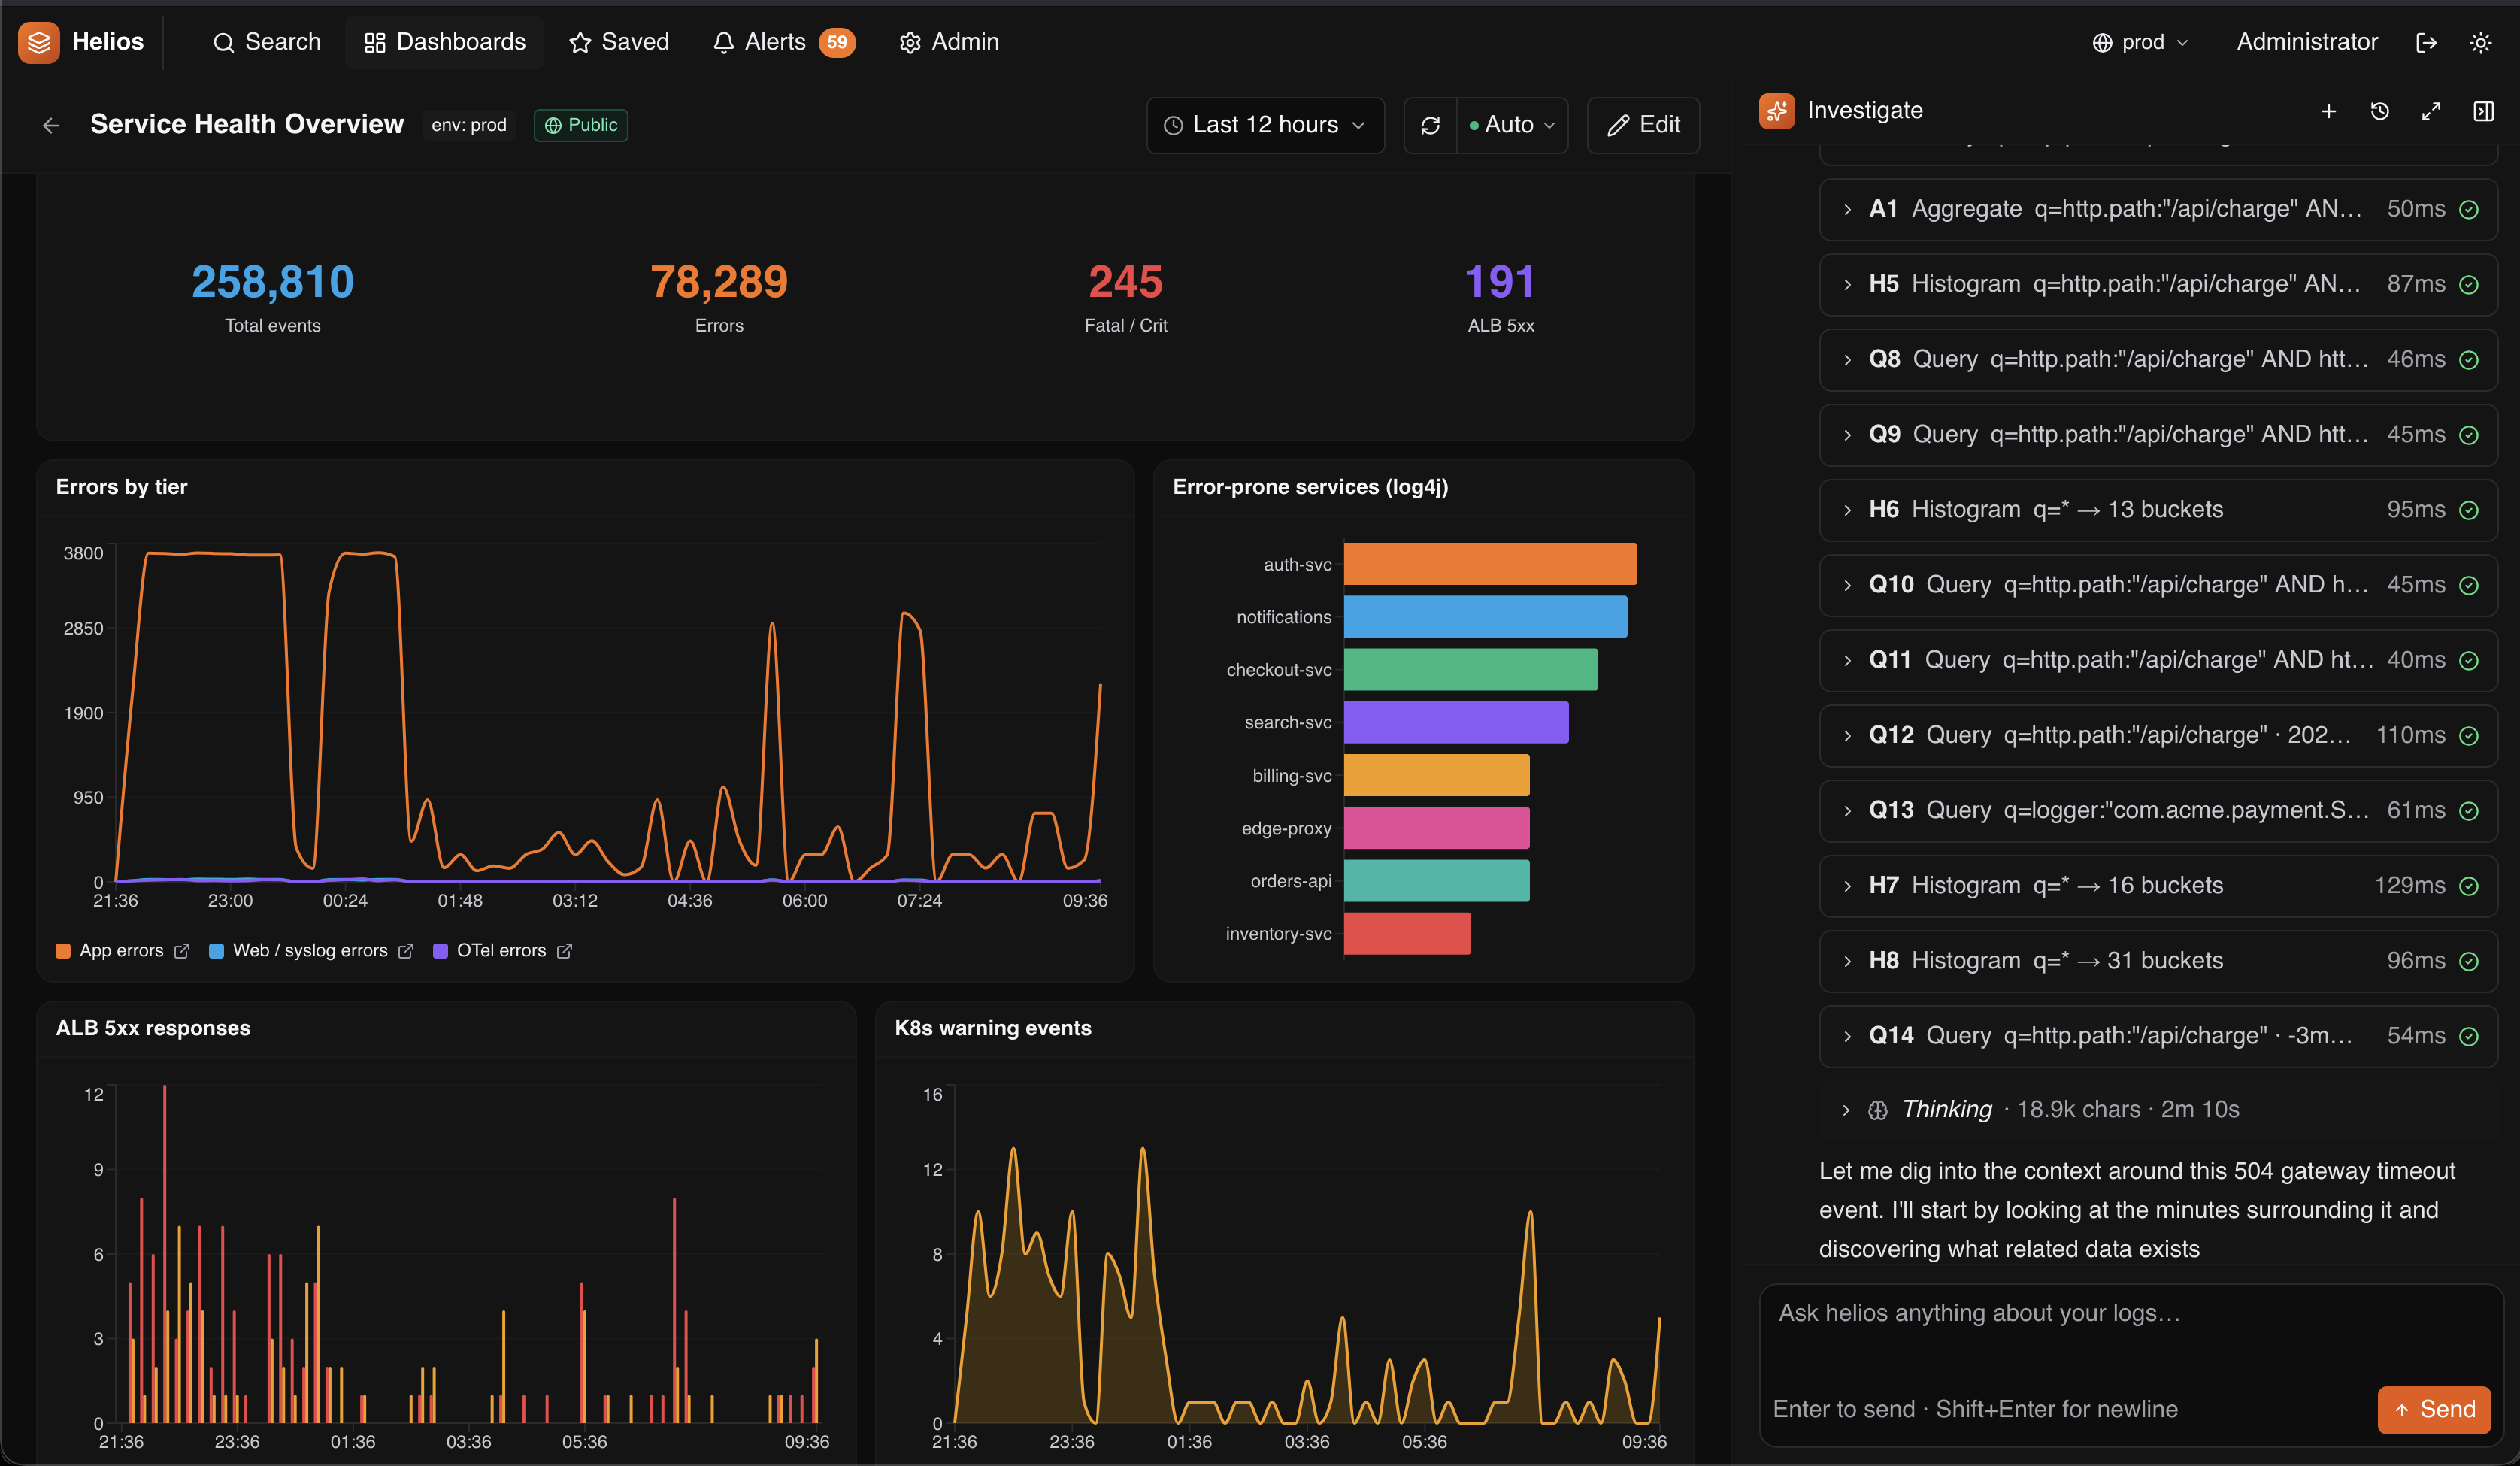
Production dashboards that stay live
Totals, error tiers, and live charts on one service-health board — built from widgets and refreshed automatically.
Drop-in for the stack you already have
Keep your shippers. HeliosLogs speaks the protocols your tools already emit — migrate without re-instrumenting a thing.
One binary.
No moving parts.
Most log stacks are a project to operate. HeliosLogs is one process.
Local-first storage — a fast columnar block engine writes to disk first; an optional shared store adds replication.
DR is "replicate the bucket" — point a fresh node at the backup and it rebuilds its cache.
Schema-on-read — no mappings to manage, no migrations, no field explosions.
No external database — the control plane is encrypted JSON on a compare-and-swap object store.
# laptop or production — the same binary
helioslogs serve --port 7300 --data-dir ./data

# scale out: point several nodes at one store
helioslogs serve --shared-store s3://logs-bucket/helios
Built for the people who run things
SREs, platform teams, and security engineers who want answers from their logs — not a second job operating the log system.
Find the needle, fast
Full-text, fields, and pipeline analytics over high-cardinality logs — with field discovery and live tail.
Catch issues early
Threshold and AI monitors watch on a schedule and alert you — with the agent's reasoning attached to the alert.
Keep it locked down
RBAC, SAML SSO, scoped API keys, an encrypted control plane, and a FIPS 140-3 build for regulated environments.
Start searching in minutes
Grab the binary, send some logs, and run your first query — the quickstart walks you through it end to end.